


A deep dive into Delaware employment (part 1 of 2)
Here are the numbers and data. The next part is how to improve them.

One of the Substacks I subscribe to is The Patriot Mind, the mind in question being a guy named . (Not to be confused with our present Governor here in Delaware, Matt Meyer.) The Mayer with an A is the President of Opportunity Ohio and has been covering the anemic prospects of the Buckeye State - and why people like me have left it - for some time.
Something Mayer harps on quite a bit is Ohio’s job situation, and in a recent post he compared his state to several others.

Bear in mind a couple key things as you look at Ohio: one, the state is a Republican trifecta as opposed to Delaware, which has been a Democrat trifecta for the last fifteen-plus years. Mayer’s state went for Donald Trump in all three of his Presidential runs, while Meyer’s Delaware (well, mostly New Castle County where Meyer was County Executive) has been reliably blue for Hillary Clinton, Joe Biden, and Kamala Harris.
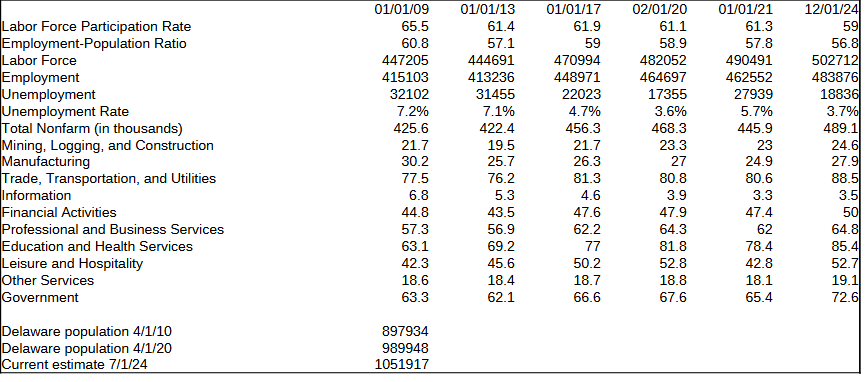
Above, at the top of the post, I have a compilation of employment numbers that I gathered in the spirit of Mayer’s comparisons. But I have a little different take and purpose. With the exception of one which I will explain in due course, the dates I use correspond with the beginning of a Governor’s term: in 2009 and 2013 were the beginning and midterm of the tenure of Governor Jack Markell - supposedly a pro-business Democrat - while 2017 and 2021 marked the beginning and midpoint for Governor John Carney. For the new governor I’m using the proxy of December’s numbers, since January’s aren’t available quite yet.
However, I added one more point of reference and that was for February, 2020 - the month before the government shut us down for the COVID scamdemic. That was pretty much peak Trump employment before the economy was crashed down - perhaps intentionally - and cost Trump the 2020 election. A lot was made about that subsequent economic recovery, but it’s a useful tool to know just where we were supposed to recover to.
But I want to look at the numbers in a more granular nature. First off, consider that Delaware’s overall population has increased about 17.1% in the overall time period - it’s not exact because Census data doesn’t overlap cleanly with the rest - but the overall workforce in that period only increased 12.4%, with a corresponding increase of employment of only 16.6%. Certainly we’ve seen a nice decrease in the unemployment rate to about half its 2009 rate (the midst of the Great Recession) but the labor force participation decline of 6.1% tells us what we already know: Delaware has been a magnet for retirees.
The idea here for me is to go through each sector and see its growth or shrinkage at each point in time, because all sectors have importance. I’ll just go in the order they are presented, using the 2009 number as a baseline.
Mining, Logging, and Construction:
Since Delaware doesn’t have much in the way of the first two (maybe a small bit of logging) most of this is construction. Numbers are expressed in thousands.
2009 (Markell 1 baseline) - 21.7
2013 (Markell 2) - 19.5 (down 10.2% term and overall)
2017 (Carney 1) - 21.7 (even for Markell’s term and overall)
2020 (pre-COVID) 23.3 (up 7.4% overall)
2021 (Carney 2) - 23.0 (up 6% for Carney’s term and overall, down 1% from pre-COVID)
2024 (Meyer) - 24.6 (up 13.4% for Carney’s term and overall, up 5.6% from pre-COVID)
It appears that these sectors have kept reasonable pace with the state’s overall growth. Much of it likely comes from the housing boom in Sussex County, where all the retirees are moving to and where much of the logging to clear former woodlots takes place. It remained 8th among the 10 sectors over the 15 years.
Manufacturing:
Perhaps the most vital sector we have as it generally creates good-paying jobs, whether unionized or not.
2009 (Markell 1 baseline) - 30.2
2013 (Markell 2) - 25.7 (down 14.9% term and overall)
2017 (Carney 1) - 26.3 (down 12.9% for Markell’s term and overall)
2020 (pre-COVID) 27.0 (down 10.6% overall)
2021 (Carney 2) - 24.9 (down 5.3% for Carney’s term, down 17.5% overall, down 7.8% from pre-COVID)
2024 (Meyer) - 27.9 (up 6.1% for Carney’s term, down 7.6% overall, up 3.3% from pre-COVID)
There was somewhat of a recovery from the Great Recession in John Carney’s term, but it was stymied to a degree by COVID. This has a good growth potential thanks to national events, but state policy may nip it in the bud as I’ll explain in part 2. This has remained in 7th place among the 10 sectors over the study period.
Trade, Transportation, and Utilities:
This is a broad sector that I think the BLS should break down, with utilities being its own category. Trade and transport go together, so I’m not sure of the logic there.
2009 (Markell 1 baseline) - 77.5
2013 (Markell 2) - 76.2 (down 1.7% term and overall)
2017 (Carney 1) - 81.3 (up 4.9% for Markell’s term and overall)
2020 (pre-COVID) 80.8 (up 4.3% overall)
2021 (Carney 2) - 80.6 (down 0.9% for Carney’s term, up 4% overall, down 0.2% from pre-COVID)
2024 (Meyer) - 88.5 (up 8.9% for Carney’s term, up 14.2% overall, up 9.5% from pre-COVID)
Perhaps the greatest success story among the private-sector jobs, which is why I wish these were separate to see where the growth really was. Obviously there was a need for more utility jobs with expanded service, but how much we don’t know. It was the largest sector until just before COVID when it slipped to number 2 but has rebounded to number 1 once again.
Information:
For what is supposedly an information economy we don’t do much here. It’s by far the smallest segment and is vanishing at an alarming rate, as you’ll see.
2009 (Markell 1 baseline) - 6.8
2013 (Markell 2) - 5.3 (down 22.1% term and overall)
2017 (Carney 1) - 4.6 (down 32.4% for Markell’s term and overall)
2020 (pre-COVID) 3.9 (down 42.6% overall)
2021 (Carney 2) - 3.3 (down 28.3% for Carney’s term, down 51.5% overall, down 15.4% from pre-COVID)
2024 (Meyer) - 3.5 (down 23.9% for Carney’s term, down 48.5% overall, down 10.3% from pre-COVID)
I had to look up what BLS was considering here, and it’s a shame Delaware isn’t cashing in on this:
The Information sector comprises establishments engaged in the following processes: (a) producing and distributing information and cultural products, (b) providing the means to transmit or distribute these products as well as data or communications, and (c) processing data.
The main components of this sector are the publishing industries, including software publishing, and both traditional publishing and publishing exclusively on the Internet; the motion picture and sound recording industries; the broadcasting industries, including traditional broadcasting and those broadcasting exclusively over the Internet; the telecommunications industries; Web search portals, data processing industries, and the information services industries.
The Information sector groups three types of establishments: (1) those engaged in producing and distributing information and cultural products; (2) those that provide the means to transmit or distribute these products as well as data or communications; and (3) those that process data.
It’s never been a big job maker, but right now it’s our biggest loser, not that it ever had a lot to begin with as the perpetual 10th place segment.
Financial Activities:
Perhaps the lifeblood of Delaware’s economy given its history.
2009 (Markell 1 baseline) - 44.8
2013 (Markell 2) - 43.5 (down 2.9% term and overall)
2017 (Carney 1) - 47.6 (up 6.3% for Markell’s term and overall)
2020 (pre-COVID) 47.9 (up 6.9% overall)
2021 (Carney 2) - 47.4 (down 0.4% for Carney’s term, up 5.8% overall, down 1% from pre-COVID)
2024 (Meyer) - 50.0 (up 5% for Carney’s term, up 11.6% overall, up 4.4% from pre-COVID)
It’s been holding relatively steady over the years, but the trajectory of this industry is slightly slower now than it was prior to COVID and recovery from the Great Recession. Once resting in a solid 5th among the 10 sectors, despite its growth it’s been passed by the Leisure and Hospitality industry - aside from when COVID hit and decimated that sector for a time.
Professional and Business Services:
AKA the white-collar economy, and now a key source of employment since that’s what I would be considered to do in my “real” job (but in Maryland.)
2009 (Markell 1 baseline) - 57.3
2013 (Markell 2) - 56.9 (down 0.7% term and overall)
2017 (Carney 1) - 62.2 (up 8.6% for Markell’s term and overall)
2020 (pre-COVID) 64.3 (up 12.2% overall)
2021 (Carney 2) - 62.0 (down 0.3% for Carney’s term, up 8.2% overall, down 3.6% from pre-COVID)
2024 (Meyer) - 64.8 (up 4.2% for Carney’s term, up 13.1% overall, up 0.8% from pre-COVID)
This started out in a close 4th place among the sectors but is now a fairly distant 4th as other sectors have grown more quickly. It’s basically kept pace with overall employment growth but has been slow to recover from COVID. While I work in Maryland now, I was part of that 8.6% increase for Markell and only detracted slightly from the pre-COVID level.
Education and Health Services:
Another category which BLS really should split into two.
2009 (Markell 1 baseline) - 63.1
2013 (Markell 2) - 69.2 (up 9.7% term and overall)
2017 (Carney 1) - 77.0 (up 22.0% for Markell’s term and overall)
2020 (pre-COVID) 81.8 (up 29.6% overall)
2021 (Carney 2) - 78.4 (up 1.8% for Carney’s term, up 24.2% overall, down 4.2% from pre-COVID)
2024 (Meyer) - 85.4 (up 10.9% for Carney’s term, up 35.3% overall, up 4.4% from pre-COVID)
It was the third-largest sector in 2009 but has seen time in each of the top three slots, making it to number one just as COVID hit and put all the teachers out of work. But the reason I would love this category separated is that both schools and hospitals have surely grown for different reasons. We’re not adding kids with the retirees moving in so that explains the hospital growth. But the demand for smaller class sizes can account for some of the education growth. I have a little more to say about this sector in a bit.
Leisure and Hospitality:
In other words, the jobs that keep the beach going. You’re not going to find many hereabouts among the chicken farms.
2009 (Markell 1 baseline) - 42.3
2013 (Markell 2) - 45.6 (up 7.8% term and overall)
2017 (Carney 1) - 50.2 (up 18.7% for Markell’s term and overall)
2020 (pre-COVID) 52.8 (up 24.8% overall)
2021 (Carney 2) - 42.8 (down 14.7% for Carney’s term, up 1.2% overall, down 18.9% from pre-COVID)
2024 (Meyer) - 52.7 (up 5% for Carney’s term, up 24.6% overall, down 0.2% from pre-COVID)
This category moved from sixth to fifth shortly after I started, and once it recovered somewhat from COVID got back into the top half over the financial sector. It was a top grower in the Markell years but COVID put a real dent in it that they haven’t completely worked their way out of.
Other Services:
According to BLS, the “Other Services… sector comprises establishments engaged in providing services not specifically provided for elsewhere in the classification system. Establishments in this sector are primarily engaged in activities, such as equipment and machinery repairing, promoting or administering religious activities, grantmaking, advocacy, and providing drycleaning and laundry services, personal care services, death care services, pet care services, photofinishing services, temporary parking services, and dating services.” Now we both know. It’s the second-smallest among groups in Delaware.
2009 (Markell 1 baseline) - 18.6
2013 (Markell 2) - 18.4 (down 1.1% term and overall)
2017 (Carney 1) - 18.7 (up 0.5% for Markell’s term and overall)
2020 (pre-COVID) 18.8 (up 1.1% overall)
2021 (Carney 2) - 18.1 (down 3.2% for Carney’s term, down 2.7% overall, down 3.7% from pre-COVID)
2024 (Meyer) - 19.1 (up 2.1% for Carney’s term, up 2.7% overall, up 1.6% from pre-COVID)
The catch-all category is growing, but very slowly. Some of these aspects are going to thrive in the Trump economy, but don’t be looking for big growth out of grantmaking and advocacy as the USAID money dries up.
Government:
Last but unfortunately not least comes government, the necessary evil. It was the second-largest sector in 2009 but quickly fell behind Education and Health Services to slip to third, where it remains.
2009 (Markell 1 baseline) - 63.3
2013 (Markell 2) - 62.1 (down 1.9% term and overall)
2017 (Carney 1) - 66.6 (up 5.2% for Markell’s term and overall)
2020 (pre-COVID) 67.6 (up 6.8% overall)
2021 (Carney 2) - 65.4 (down 1.8% for Carney’s term, up 3.3% overall, down 3.3% from pre-COVID)
2024 (Meyer) - 72.6 (up 9% for Carney’s term, up 14.7% overall, up 7.4% from pre-COVID)
Any growth there is too much, as government has grown a lot since the Great Recession. Maybe that explains the rapid growth of the state budget?
There are three final, additional ways I want to slice and dice the BLS data, and the first two are job growth by sector, both overall and since COVID.
Growth rates overall since 2009 (overall 16.6%):
Education and Health Services, 35.3%
Leisure and Hospitality, 24.6%
Government, 14.7%
Trade, Transportation, and Utilities, 14.2%
Mining, Logging, and Construction, 13.4%
Professional and Business Services, 13.1%
Financial Activities, 11.6%
Other Services, 2.7%
Manufacturing, (-7.6%)
Information, (-48.5%)
Growth rates overall since COVID (overall 4.1%):
Trade, Transportation, and Utilities, 9.5%
Government, 7.4%
Mining, Logging, and Construction, 5.6%
Education and Health Services, 4.4%
Financial Activities, 4.4%
Manufacturing, 3.3%
Other Services, 1.6%
Professional and Business Services, 0.8%
Leisure and Hospitality, (-0.2%)
Information, (-10.3%)
Lastly, I want to get into something Matt uses as a measuring stick: the number of what he called Taxpayer Funded jobs, a combination of Government plus Education and Health Services. This last list is the total as well as the percentage of all employment for each time period.
2009: 126.4 (30.5% of all jobs.)
2013: 131.3 (31.8%)
2017: 143.6 (32.0%)
2020 (pre-COVID): 149.4 (32.1%)
2021: 143.8 (31.1%)
2024: 158.0 (32.7%)
All along, the public-funded jobs have been creeping upward, as the takers gain on the makers. Without all of the eye-glazing data, I’m going to talk about what to do about that next week in Part 2.
In the meantime, though, you can Buy Me a Coffee, since I have a page there now.